
The new year brings us new opportunities to provide the information you need to best capitalize on the point-of-care landscape. Our analysis of end-of-year patient traffic data offers key 2023 predictions you should be aware of.
Patient Traffic Levels Will Remain at Pre-Pandemic Norms
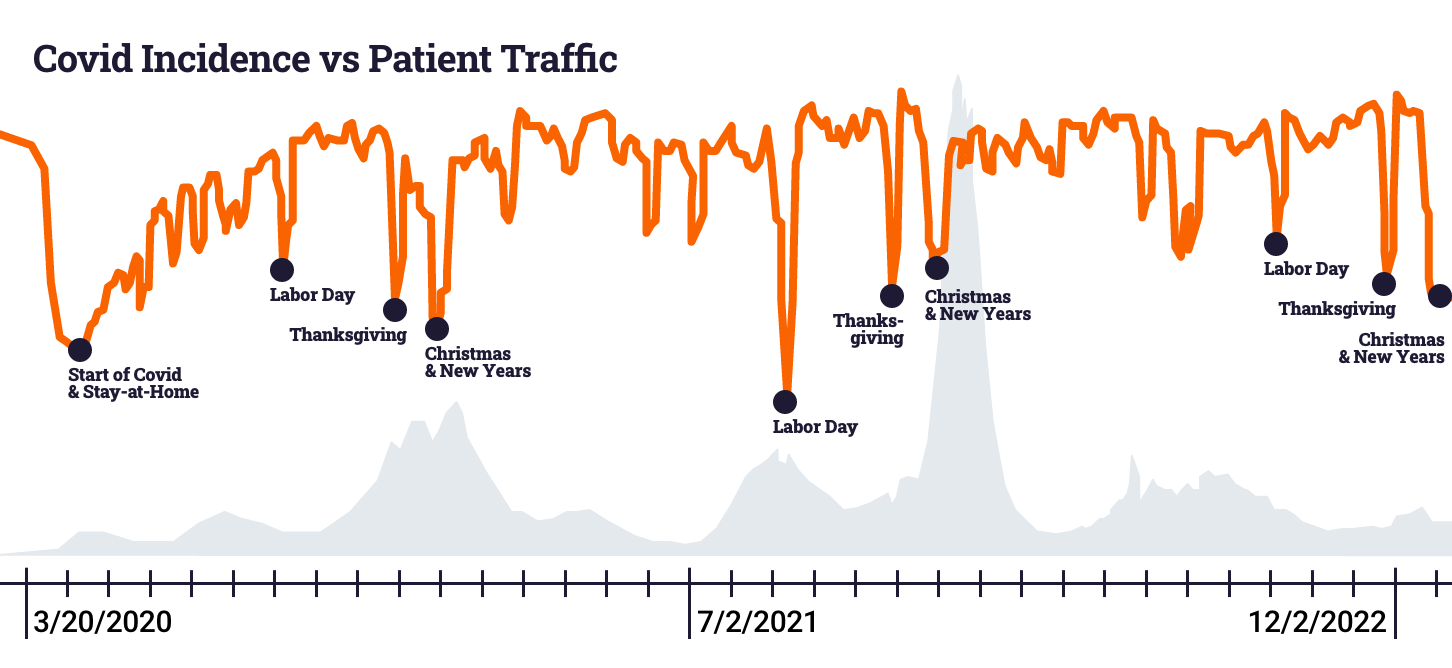
In 2022, we reported a return to pre-pandemic levels as office traffic continued to increase independently of COVID incidences throughout the year. We predict patient traffic levels will remain steady in 2023, as health remains a top priority within our ‘new normal.’
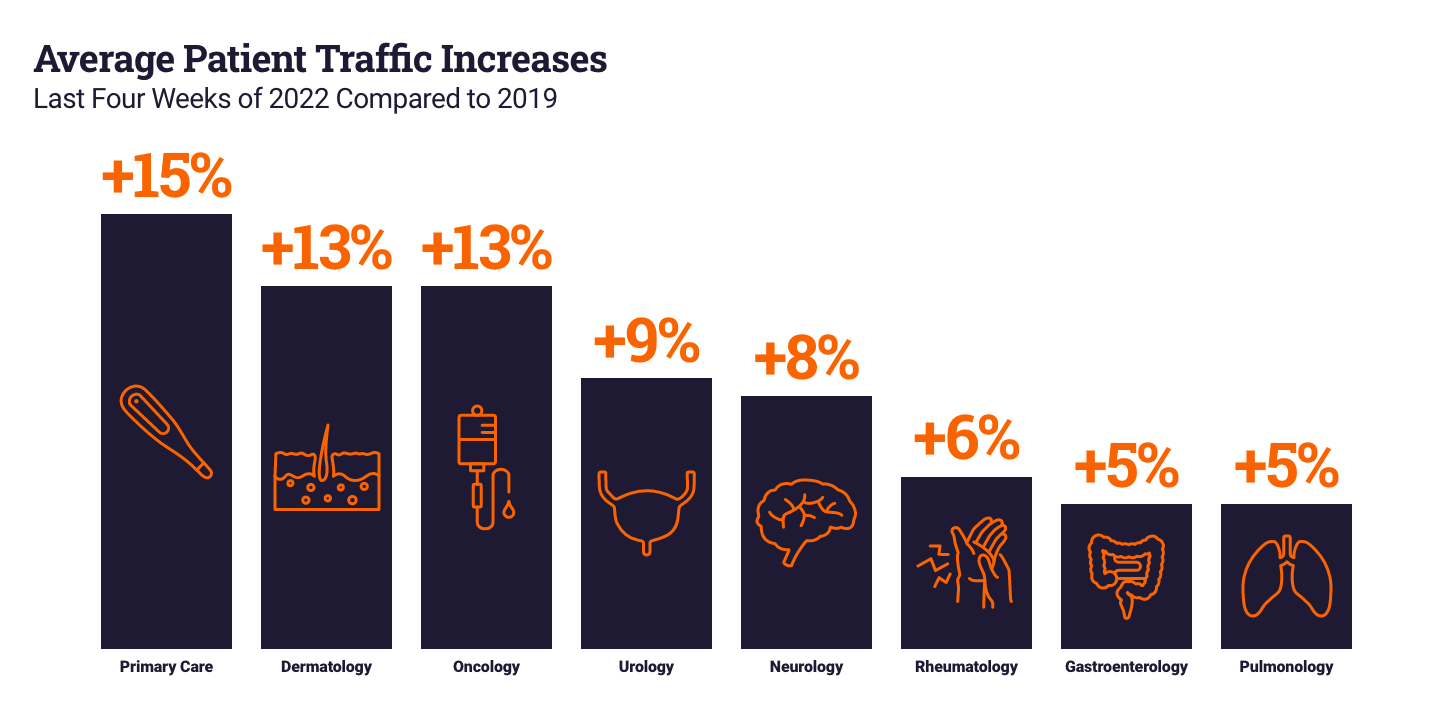
By the end of 2022, all specialties had patient traffic trending at or above pre-COVID levels, with primary care, oncology and dermatology registering the highest increases in patient traffic compared to 20191.
As in-office visits steadily increased in 2022, telehealth usage remained low–with visits at or below 5% for all specialties except endocrinology, rheumatology, primary care and neurology2.
The Waiting Room Will Remain a Key Moment of Impact
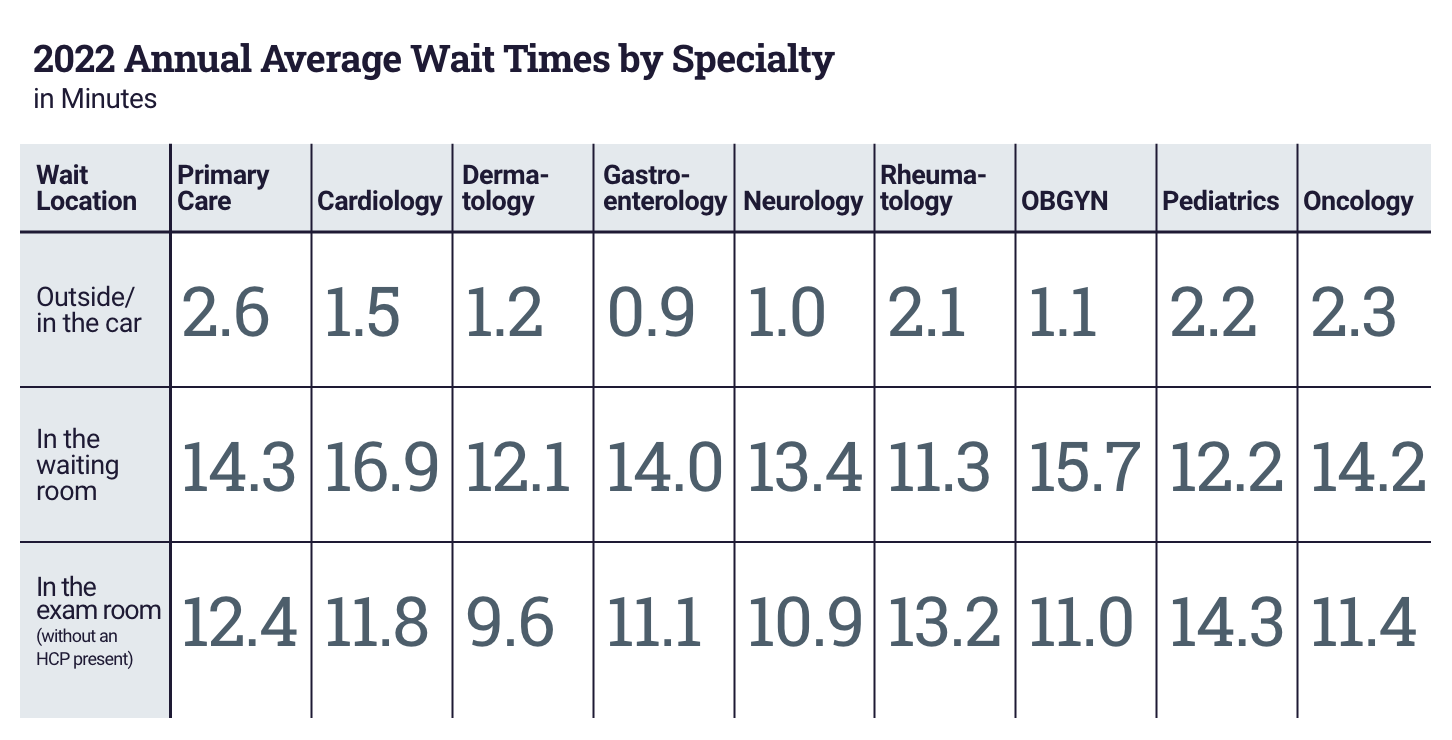
Our 2022 data revealed that 97% of patients spent time in the waiting room for an average of 13.8 minutes. They spent an additional 12.4 minutes waiting in the exam room. This data is consistent with 2021. However, the time spent waiting in the car in 2022 was less than half compared to 2021 data3. We expect similar data in 2023.
Key Takeaways
As we enter 2023, our data reveals people have adjusted to the new normal COVID created. COVID incidence and activities such as travel and doctor’s office visits have trended independently since 2020, and we expect them to continue to do so in 2023. PatientPoint will continue to share insights into the latest patient traffic and wait times trends to help guide your planning accordingly.